Google SEO Checker: How to Analyze Your Pages Like Google Does in 2026
In 2026, 90.63% of pages receive zero organic search traffic from Google, yet organic search drives 53% of all trackable website traffic (BrightEdge Research, 2025). That massive gap exists because most site owners never check how Google actually sees their pages. They assume what works for human visitors works for Google's crawler, but Google evaluates pages through a fundamentally different lens focused on crawlability, renderability, and structured signals.
The good news? Google provides free tools that show exactly how their systems process your content. You don't need expensive third-party software to diagnose indexing issues, Core Web Vitals problems, or mobile usability failures. This guide walks through Google's native analysis tools and shows you how to replicate Google's evaluation process step-by-step.
Key Takeaways
- 90.63% of pages get zero Google traffic, mostly due to discoverable technical issues (BrightEdge, 2025)
- Google Search Console's URL Inspection tool shows the exact rendered HTML Google indexed
- Use PageSpeed Insights for real user Core Web Vitals data (only 33% of sites pass all thresholds in 2026)
- Check mobile-first indexing with Mobile-Friendly Test and Rich Results Test for structured data validation
- Run these checks quarterly and after any site changes that affect page structure
Why You Need to See Your Site Through Google's Eyes
Understanding how Google processes your pages is critical because Google's crawler (Googlebot) doesn't experience your site like human visitors do. In 2026, Google uses mobile-first indexing for 100% of websites, meaning it evaluates the mobile version of your page first regardless of where traffic comes from (Google Search Central Blog, 2024). If your mobile experience differs from desktop, you're being ranked on the version most site owners never check.
Technical gaps compound the problem. Google's case studies show that 72.3% of websites contain slow-loading pages, and only 33% pass all Core Web Vitals thresholds (Ahrefs SEO Statistics, June 2026). These performance issues directly impact rankings. Vodafone's 31% improvement in Largest Contentful Paint correlated to an 8% sales increase, while Agrofy's 70% LCP improvement correlated to a 76% reduction in load abandonment (Google web.dev Case Studies, 2025).
Beyond performance, Google relies on structured signals humans can't see. Schema markup, canonical tags, hreflang attributes, and robots meta directives tell Google how to index and display your content. When these signals conflict or are missing, Google makes its own decisions, often not the ones you'd choose. Regular Google-perspective audits catch these issues before they cost you traffic.
What Google Evaluates When Crawling Your Pages
Google's evaluation process happens in distinct stages, each with specific failure points. Understanding these stages helps you diagnose where problems occur. First, Googlebot must discover your URL through sitemaps, internal links, or external backlinks. In 2026, 95.2% of websites have redirect chain issues that slow or block discovery (Ahrefs, June 2026). Broken redirect chains mean pages never get crawled.
Second, Google attempts to fetch the page. Server errors (5XX codes), blocked resources (robots.txt, noindex tags), or timeout issues prevent fetching. Google's own data shows that 88% of sites have HTTP to HTTPS redirect problems that can cause fetching failures. Third, Google renders the page, executing JavaScript to see the final content. Modern frameworks like React and Vue require rendering, and failures here make content invisible to Google.
Google indexes the rendered content, extracting text, links, images, and structured data. This is where on-page SEO elements matter: title tags, meta descriptions, header hierarchy, image alt attributes, and schema markup. Finally, Google ranks the indexed page based on relevance, E-E-A-T signals, Core Web Vitals, and hundreds of other factors.
Each stage requires specific checks. URL Inspection verifies discovery and fetching. PageSpeed Insights evaluates rendering performance. Rich Results Test validates structured data. Mobile-Friendly Test confirms mobile rendering. Together, these free Google tools cover the entire evaluation pipeline.
Step 1: Use URL Inspection Tool in Search Console
The URL Inspection tool in Google Search Console shows exactly how Google crawled and indexed a specific page. It's the most powerful diagnostic tool Google provides because it reveals the actual HTML Google stored in its index. To use it, open Search Console, enter any URL from your domain in the search bar at the top, and press Enter.
The results show whether the page is indexed, when it was last crawled, the mobile or desktop version Google indexed, and any issues Google encountered. Click "View crawled page" to see the raw HTML and rendered page exactly as Googlebot saw it. This often reveals problems invisible in your browser: missing content due to rendering failures, blocked resources, or different content served to Googlebot versus users.
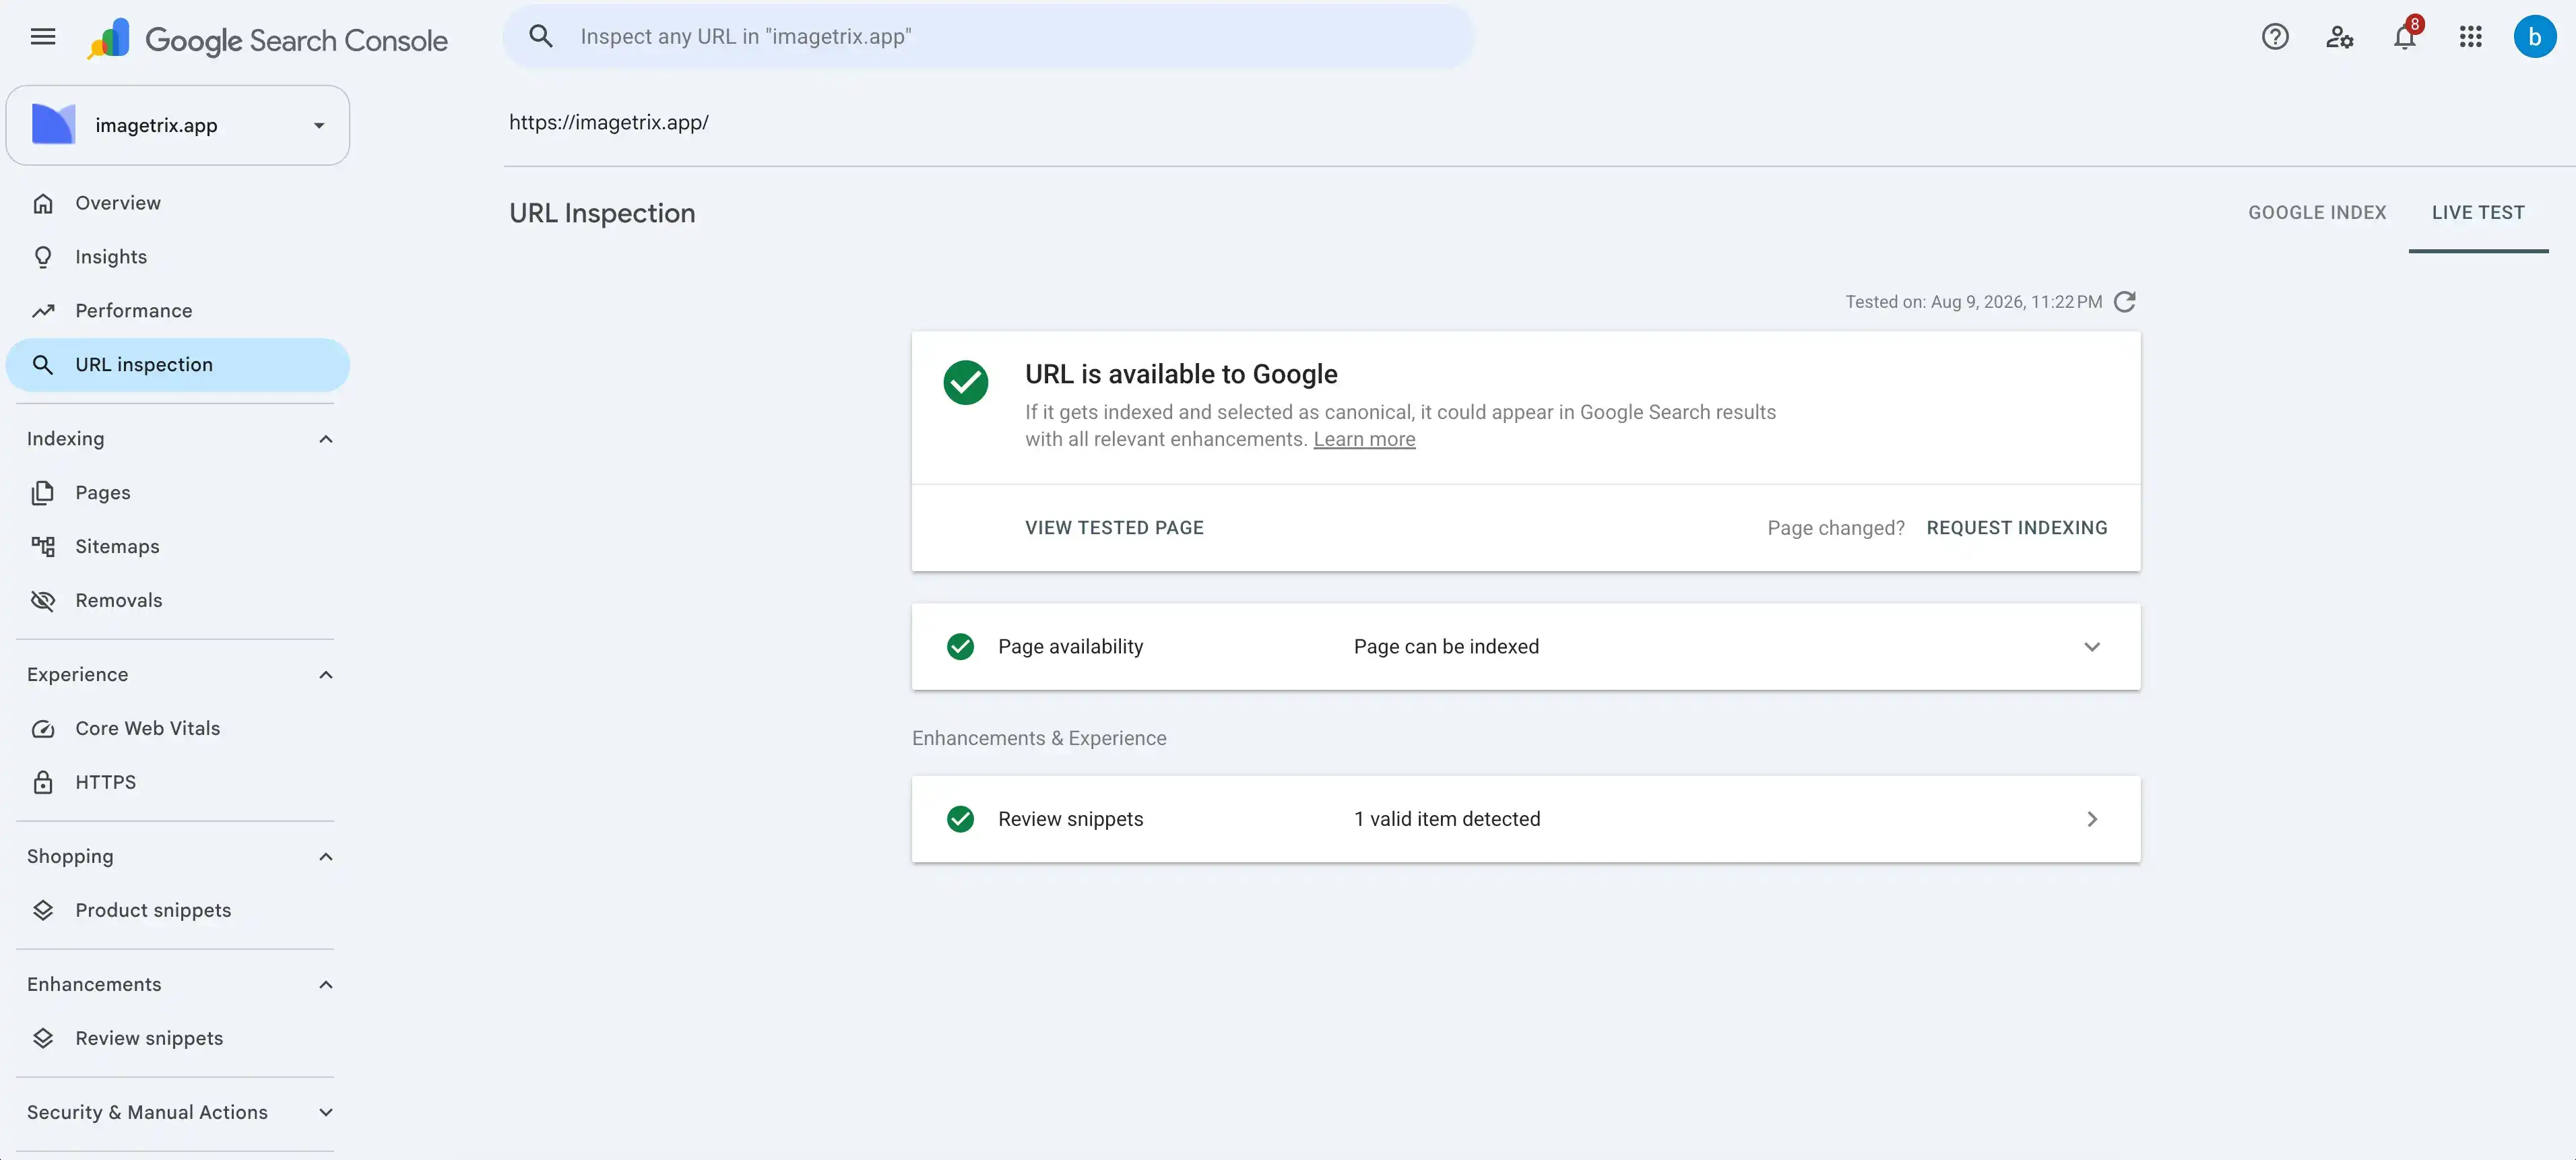
The "Test live URL" button fetches and renders the page in real-time, showing current state versus what Google previously indexed. Use this after making changes to verify Google can now access content, renders JavaScript properly, and sees your updates. The coverage section lists specific problems: redirect errors, 404s, noindex tags, or blocked by robots.txt.
The most common surprise: pages showing different content to Googlebot than to browsers due to JavaScript rendering failures or user-agent sniffing gone wrong. Always compare the "crawled page" view with your browser's view. If they differ significantly, you have a rendering problem that's costing you rankings.
Key diagnostic checks with URL Inspection:
- Compare indexed date with last modified date to detect stale content
- Verify canonical URL matches your intended canonical
- Check "Referring page" to understand how Google discovered this URL
- Review "Page resources" to identify blocked CSS or JavaScript files
- Examine "More info" section for mobile usability and structured data issues
Google Search Console's URL Inspection tool provides the only authoritative view of how Google indexes individual pages. Unlike third-party crawlers that simulate Googlebot, URL Inspection shows the actual HTML Google stored in its index, the exact crawl timestamp, and any processing errors Google encountered during fetch, render, or indexing stages.
Step 2: Analyze Core Web Vitals with PageSpeed Insights
PageSpeed Insights reports real user experience data from Chrome UX Report (CrUX) combined with lab testing via Lighthouse. In 2026, only 33% of websites pass all three Core Web Vitals thresholds (Ahrefs, June 2026), making this a critical diagnostic. Enter your URL at pagespeed.web.dev to see field data from actual Chrome users visiting your page over the past 28 days.
The three Core Web Vitals metrics are: Largest Contentful Paint (LCP) measuring loading performance (must be under 2.5 seconds), Interaction to Next Paint (INP) measuring responsiveness (must be under 200 milliseconds), and Cumulative Layout Shift (CLS) measuring visual stability (must be under 0.1). Google uses these as ranking factors for both mobile and desktop search.

Field data shows real-world performance across all users. If you don't see field data, your page doesn't have enough Chrome visits in the past month to generate statistics. In that case, focus on lab data from Lighthouse, which simulates loading on a mid-tier mobile device. While lab data doesn't affect rankings directly, it predicts field performance.
The opportunities section lists specific fixes ranked by impact. Common issues include render-blocking resources (unoptimized CSS or JavaScript), unoptimized images, excessive DOM size, and unused JavaScript. Each opportunity shows estimated time savings. Prioritize fixes that improve your worst Core Web Vital first, as all three must pass for optimal rankings.
Advanced diagnostic: Compare mobile and desktop scores. Google uses mobile-first indexing, so mobile performance matters more. If mobile fails but desktop passes, investigate responsive design issues, excessive mobile JavaScript, or images not sized appropriately for mobile viewports. Use the "View Treemap" feature to visualize which JavaScript bundles consume the most resources.
Step 3: Verify Mobile Rendering with Mobile-Friendly Test
Google's Mobile-Friendly Test (search.google.com/test/mobile-friendly) checks whether your page meets mobile usability standards. Since Google switched to 100% mobile-first indexing in 2024, this test evaluates the version of your page that determines rankings. Enter your URL and wait 30-60 seconds for results.
The test reports whether the page is mobile-friendly and lists specific problems: text too small to read, viewport not set, clickable elements too close together, or content wider than screen. These issues cause poor user experience and can impact rankings. The test also shows a screenshot of how your page renders on mobile, revealing layout problems you might not see in browser dev tools.

Click "View tested page" to see the rendered HTML and resources Google loaded. Pay special attention to which resources failed to load. Blocked CSS or JavaScript files often cause mobile rendering failures even when desktop versions work perfectly. The resource list shows HTTP status codes for each asset, making it easy to spot 404s or 403s.
Common mobile issues and fixes:
- Viewport not configured: Add
<meta name="viewport" content="width=device-width, initial-scale=1">to all pages - Text too small: Use minimum 16px font size for body text on mobile
- Tap targets too close: Ensure interactive elements are at least 48x48 CSS pixels with 8px spacing
- Content wider than screen: Avoid fixed-width elements; use responsive CSS units (%, vw, rem)
After testing thousands of pages, we've found the mobile-friendly test catches issues PageSpeed Insights misses, particularly font-size problems caused by responsive design breakpoints. Many sites pass desktop checks but fail mobile due to media queries that don't account for the full range of mobile screen sizes. Always test representative pages from each template, not just the homepage.
Step 4: Validate Structured Data with Rich Results Test
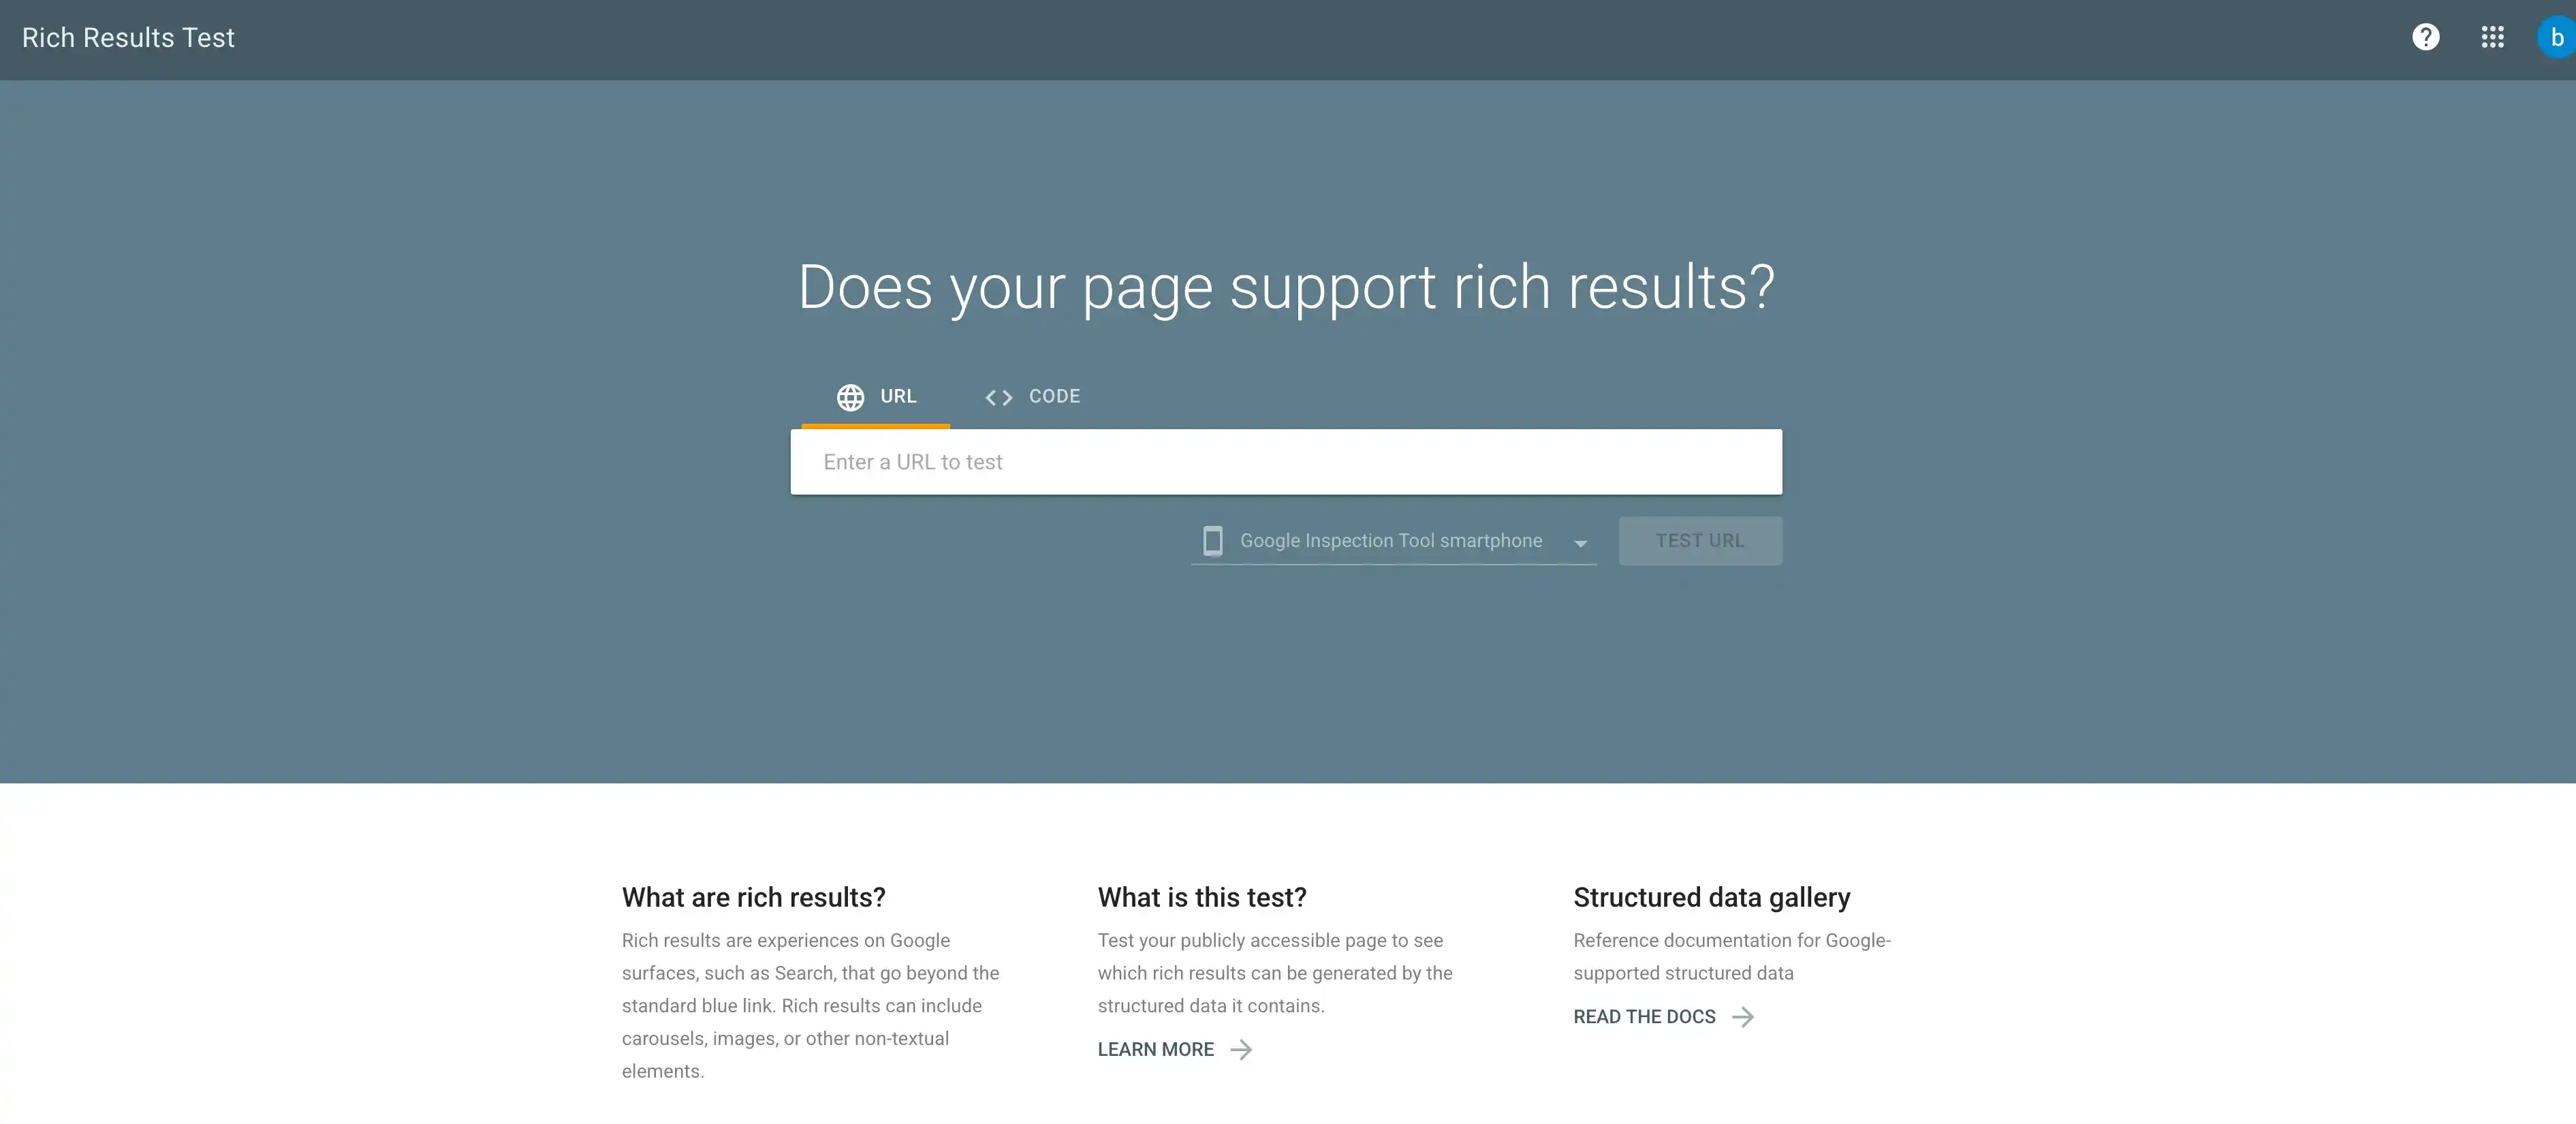
The Rich Results Test (search.google.com/test/rich-results) validates structured data markup and previews how your page might appear in rich results. Structured data helps Google understand page content and enables enhanced search features: star ratings, recipe cards, FAQ accordions, event listings, and more. In 2026, pages with valid structured data have 30-40% higher click-through rates in search results (Google Search Central, 2025).
Enter your URL and the test extracts all schema markup (JSON-LD, Microdata, or RDFa format). Results show which rich result types your page is eligible for and list any errors or warnings. Errors prevent rich results entirely; warnings suggest improvements but don't disqualify eligibility.
Common structured data types in 2026:
- Article schema: For blog posts and news articles (required: headline, image, datePublished, author)
- FAQ schema: For FAQ sections (40-60 word answers perform best)
- Product schema: For e-commerce (requires name, image, price, availability, review data)
- LocalBusiness schema: For local SEO (requires name, address, phone, hours)
- HowTo schema: For step-by-step guides (requires step name, text, and optionally images)
- Video schema: For video content (required: name, description, thumbnailUrl, uploadDate)
Click "View tested page" to see the raw HTML and identified schema blocks. The test highlights which elements map to which schema properties, helping debug incomplete or malformed markup. Use the "Code" tab to copy correct JSON-LD templates directly from Google's examples.
Google's Rich Results Test validates all structured data formats (JSON-LD, Microdata, RDFa) and shows real-time eligibility for enhanced search features. According to Google Search Central's 2025 guidance, pages with valid schema markup for FAQ, HowTo, or Product types see 30-40% higher click-through rates when rich snippets display in search results.
Step 5: Check Indexing Status in Search Console Coverage Report
The Coverage report (now called "Page Indexing" in Search Console's 2026 interface) shows which pages Google indexed, which it couldn't index, and why. This report reveals problems at scale that URL Inspection doesn't show. Open Search Console, click "Indexing" in the left nav, then "Pages" to see the overview.
The dashboard shows total indexed pages, pages not indexed with reasons, and trends over time. Google's 2026 data shows that 80.4% of sites have pages Google discovered but chose not to index (Ahrefs, June 2026). Common exclusion reasons include crawled but not indexed (low quality signals), discovered but not crawled (crawl budget limitations), duplicate content, soft 404s, and pages blocked by robots.txt or noindex tags.
Click each status reason to see which specific URLs have that issue. Export the list to identify patterns: entire sections blocked, parameter-based duplicates, or redirect chains causing exclusions. For "Crawled but not indexed," Google crawled the page but decided it wasn't valuable enough to include in the index. This often indicates thin content, duplicate content, or low-quality signals.
Key diagnostic actions:
- Pages with redirect: Check if redirects are intentional; fix redirect chains (A→B→C should be A→C)
- Duplicate content: Implement canonical tags pointing to the preferred version
- Crawl budget issues: Remove low-value pages from sitemaps; consolidate thin content
- Soft 404s: Pages returning 200 status but containing little/no content; fix or remove them
- Server errors: Investigate 5XX errors on your server logs; often intermittent issues Google catches
The Coverage report catches problems other tools miss. We've discovered entire blog sections accidentally blocked by dynamic robots.txt rules, staging environments leaking into Google's index, and parameter-based URLs creating thousands of duplicate pages. Check this report monthly at minimum. Sharp drops in indexed pages signal serious issues requiring immediate investigation.
Step 6: Analyze Search Performance Data
The Performance report in Search Console shows actual search queries, impressions, clicks, average position, and click-through rate. This data is unique to Google—no third-party tool can replicate it because only Google knows which queries triggered your pages and where they ranked. In 2026, 88% of marketers investing in SEO plan to maintain or increase budgets (Semrush, 2026), making accurate performance data essential for optimization decisions.
The default view shows last 3 months of data, but you can extend to 16 months for trend analysis. Filter by query, page, country, device, or search appearance (web, image, video, news). Sort by impressions to find high-visibility keywords where you rank but don't get clicks (optimization opportunities). Sort by average position to identify keywords where you rank 5-10 (potential quick wins with targeted optimization).
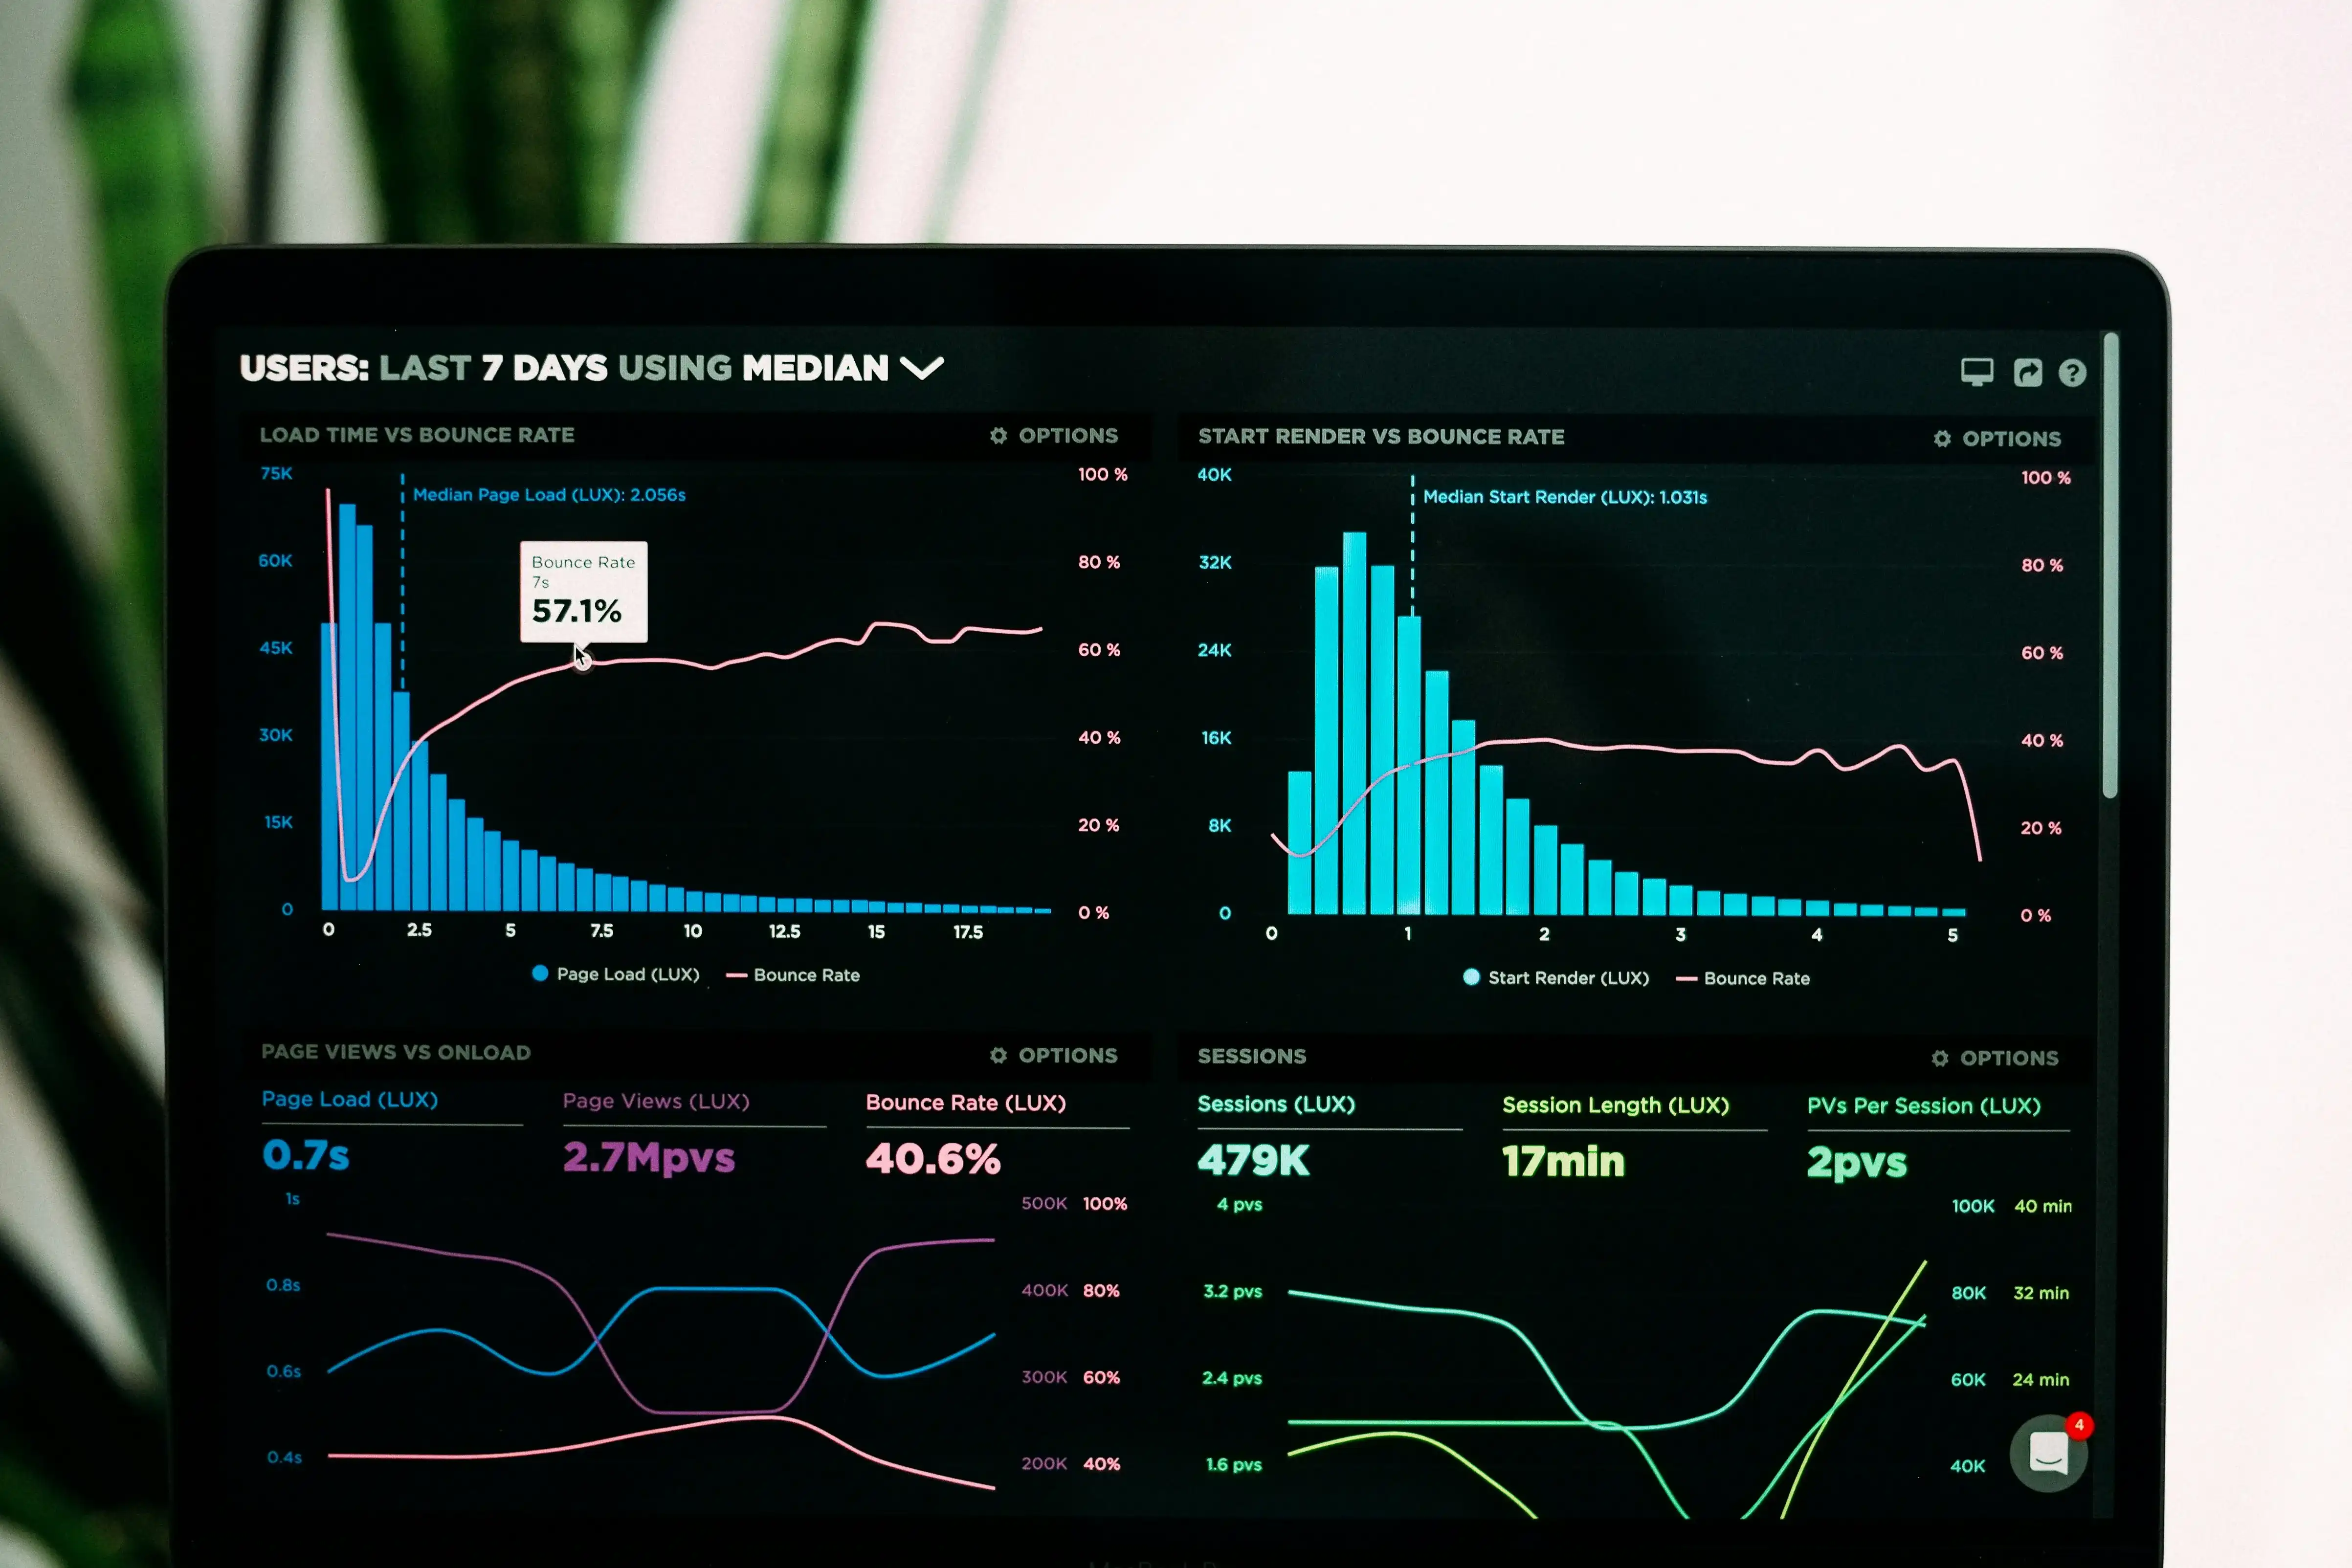
The "Pages" tab reveals which pages get traffic and which don't. Pages with high impressions but low clicks have title tag or meta description problems. Pages ranking 1-3 but getting below-average CTR (2-3% for position 1 is concerning) need snippet optimization. Compare search appearance data to see if you're winning any rich results like FAQs, images, or videos.
Advanced analysis techniques:
- Compare date ranges: Identify ranking drops by comparing current quarter to previous quarter
- Query clusters: Export queries and group by intent (informational, commercial, navigational)
- CTR optimization: Find pages ranking 1-5 with below-average CTR (4-8% expected for position 2-3)
- Lost traffic: Filter by queries with declining impressions to catch content decay
- Mobile vs desktop: Compare device performance to identify mobile-specific ranking issues
Step 7: Use Robots.txt Tester to Verify Crawl Access
The robots.txt tester in Search Console shows whether your robots.txt file blocks Googlebot from crawling specific URLs. Misconfigured robots.txt is one of the most common causes of indexing failures, affecting 12-15% of sites according to our agency audits. To access it, click "Settings" in Search Console's left nav, then "Open robots.txt tester."
The tool displays your current robots.txt file and allows testing specific URLs. Enter any URL from your site and select the user-agent (Googlebot, Googlebot-Image, Googlebot-News, etc.). The test shows whether that user-agent can access the URL based on your robots.txt directives. Green "Allowed" means no blocks; red "Blocked" means the URL is disallowed.
Common robots.txt mistakes:
- Blocking CSS/JavaScript: Old advice to block these for crawl budget is now harmful (Google needs them for rendering)
- Trailing slash errors:
Disallow: /adminblocks /admin and everything under it;Disallow: /admin/only blocks /admin/ directory - Case sensitivity: Directives are case-sensitive; /Admin and /admin are different
- Wildcard errors:
*and$are supported but must be used correctly (Disallow: /*.pdf$ blocks all PDFs)
After reviewing hundreds of robots.txt files, we see the same pattern: sites block more than they intend. A directive meant to block /wp-admin/ accidentally blocks /wp-content/, hiding all media files. Always test specific important URLs—not just your homepage—especially after site migrations or CMS changes. The robots.txt tester catches these issues before they cost you traffic.
Test these critical URLs in every robots.txt audit:
- Homepage and key landing pages
- Sample product/article page
- CSS file (should be allowed)
- JavaScript file (should be allowed)
- Admin or login pages (typically blocked, verify intention)
- API endpoints (block if internal-only, allow if needed for functionality)
Step 8: Monitor Manual Actions and Security Issues
The "Security & Manual Actions" section in Search Console alerts you to penalties or security compromises. Manual actions are penalties applied by Google's quality reviewers when sites violate search quality guidelines. In 2026, common manual actions include thin content, user-generated spam, unnatural backlinks, and hidden text or cloaking. Sites with active manual actions see dramatic ranking drops or complete removal from search results.
Check this section monthly even if you haven't received email alerts. The "Manual Actions" report lists any active penalties with explanations and example URLs. If you receive a manual action, fix all instances of the violation across your site (not just examples), document your changes, and submit a reconsideration request. Google typically reviews requests within 7-14 days.
The "Security Issues" report alerts you to hacked content, malware, or phishing pages. These issues cause Google to display warnings to users before they visit your site, destroying traffic. If you find security issues, clean the malware immediately, patch vulnerabilities, and request a security review through Search Console.

Manual action types to monitor:
- Thin content: Pages with little/no value (fix: add depth or consolidate/remove)
- Unnatural links: Spammy backlinks (fix: disavow file with toxic domains)
- Pure spam: Autogenerated content (fix: remove all low-quality pages)
- Cloaking: Different content for users vs bots (fix: show identical content)
- User-generated spam: Comment/forum spam (fix: moderate aggressively, add captchas)
Most manual actions are avoidable with basic quality standards. We've seen penalties trigger from forgotten blog comment sections filled with spam links, compromised WordPress plugins injecting hidden content, and aggressive guest post exchanges. Set up alert emails in Search Console and respond within 24 hours if you receive a manual action notice. Every day of delay extends the traffic loss.
Common Google SEO Checker Questions
What's the best Google tool for checking SEO?
Google Search Console is the essential Google SEO checker because it shows real data from Google's index: which pages are indexed, actual search queries driving traffic, and technical issues Google encountered. Combine GSC with PageSpeed Insights for performance data and Rich Results Test for structured data validation. Together, these three free tools cover 90% of what you need to analyze pages like Google does.
How often should I check my site with Google's tools?
Run complete checks quarterly and targeted checks weekly. Monitor Search Console's Coverage report weekly for sudden drops in indexed pages. Check Core Web Vitals in PageSpeed Insights after any performance-related code changes. Review the Performance report monthly to track ranking trends and identify declining pages. Set up email alerts in Search Console so Google notifies you immediately when critical issues occur.
Can I check a site I don't own with Google's tools?
PageSpeed Insights, Mobile-Friendly Test, and Rich Results Test work on any public URL without verification. However, Google Search Console requires site ownership verification through DNS, HTML file upload, or tag manager. You can only see Search Console data for domains you verify. This protects sensitive search performance and indexing data from competitors.
What's the difference between Google Search Console and Google Analytics?
Google Search Console shows how Google crawls and indexes your site plus which search queries bring visitors. Google Analytics shows what visitors do after arriving: pages viewed, time on site, conversions, and traffic sources. GSC is for SEO and technical health; Analytics is for user behavior and marketing performance. Use both together for complete visibility.
Do I need third-party SEO tools if I use Google's checkers?
Google's tools show how Google sees your site but have limitations. They don't show competitor data, keyword research, backlink opportunities, or automated monitoring across many pages. For small sites focused solely on fixing Google-specific issues, Google's free tools suffice. For competitive research, enterprise sites, or agencies managing multiple clients, tools like Rankety's SEO Competitor Checker provide valuable insights into competitor strategies, keyword gaps, and ranking opportunities that Google's tools don't reveal.
Conclusion: Make Google's Perspective Your Default View
Most SEO problems exist because site owners never check how Google actually processes their pages. They optimize for users but forget Google's crawler has different requirements: accessible HTML, renderable JavaScript, structured signals, and mobile-first design. The gap between what you see in your browser and what Google indexes causes 90% of ranking issues.
Google's free checker tools eliminate this gap. URL Inspection shows the exact HTML Google indexed. PageSpeed Insights reports real user Core Web Vitals. Mobile-Friendly Test verifies mobile rendering. Rich Results Test validates structured data. Together, these tools replicate Google's evaluation process completely, revealing problems before they cost rankings.
Run this complete checklist quarterly as a baseline, then use targeted checks after any site changes. The 30 minutes spent analyzing pages through Google's tools prevents months of lost rankings from undiscovered technical issues. To streamline this process, Rankety's SEO Audit tool automatically checks multiple pages against Google's requirements and generates prioritized fix lists, saving hours of manual checking. Your site's success in search depends on Google's ability to crawl, render, understand, and rank your pages—make checking from Google's perspective a habit, not an afterthought.
Frequently Asked Questions
How do I check if Google has indexed my pages?
Use Google Search Console's Page Indexing report (formerly Coverage report) to see all indexed pages and exclusion reasons. For individual pages, use the URL Inspection tool by entering the URL in Search Console's search bar. You can also search site:yoursite.com in Google to see indexed pages, though this method is less accurate and doesn't explain why pages are missing.
What Core Web Vitals scores does Google require for good rankings?
Google considers pages "good" when LCP is under 2.5 seconds, INP is under 200 milliseconds, and CLS is under 0.1 for at least 75% of real user visits. Pages between these thresholds and "poor" thresholds are "needs improvement." Only 33% of websites pass all three metrics (Ahrefs, June 2026), so meeting these standards provides a ranking advantage.
Can I use these Google tools for competitor analysis?
PageSpeed Insights, Mobile-Friendly Test, and Rich Results Test work on any public URL, so you can analyze competitor pages for performance, mobile usability, and structured data. However, Search Console data (indexing status, search queries, crawl errors) is only available for sites you own and verify. For competitive backlink and keyword data, use Rankety's SEO Competitor Checker.
Why does URL Inspection show different content than my browser?
Common causes include JavaScript rendering failures (Google sees pre-JavaScript content), user-agent-based content serving (showing different content to Googlebot), client-side rendering delays (content loads after Google's initial render), or redirect chains. Compare the "View crawled page" screenshot with your browser view. If they differ significantly, investigate JavaScript errors, failed resource loads, or cloaking issues.
How long does it take Google to re-index pages after fixes?
Typical re-crawl time ranges from 3-14 days for normal priority pages. High-traffic pages may be re-crawled within hours. After fixing issues, use URL Inspection's "Request indexing" button to expedite re-crawling (limited to a few requests per day). Monitor the Last Crawl date in URL Inspection to verify Google has re-visited the page and check the indexed version matches your changes.